Bar Chart Reveal
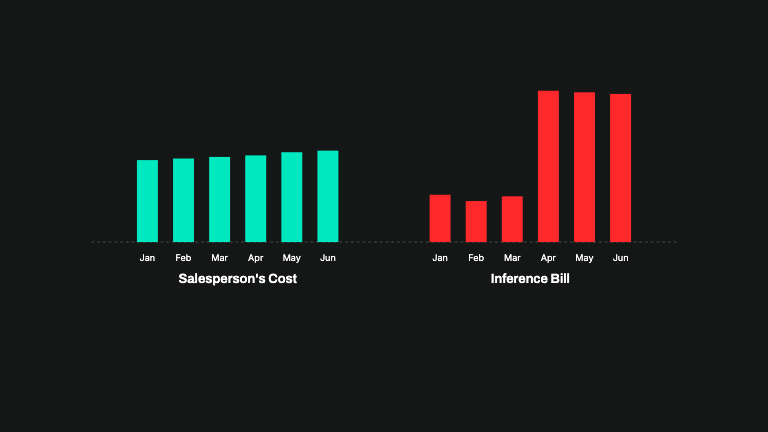
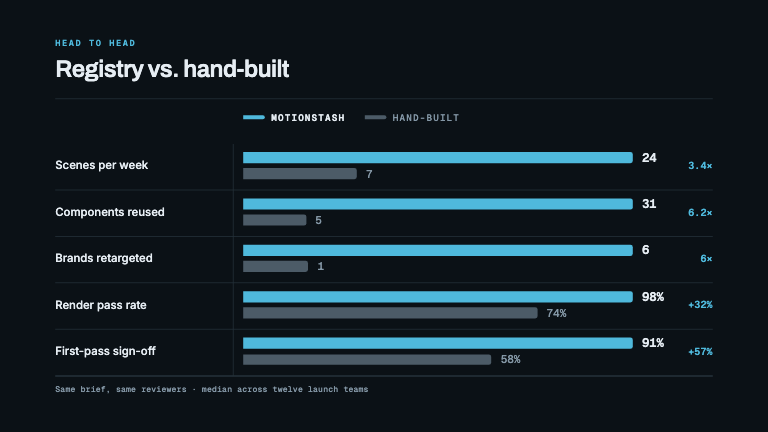
DataGridlines draw on as hairlines, bars climb from the baseline in reading order, and each value counts up as its bar lands
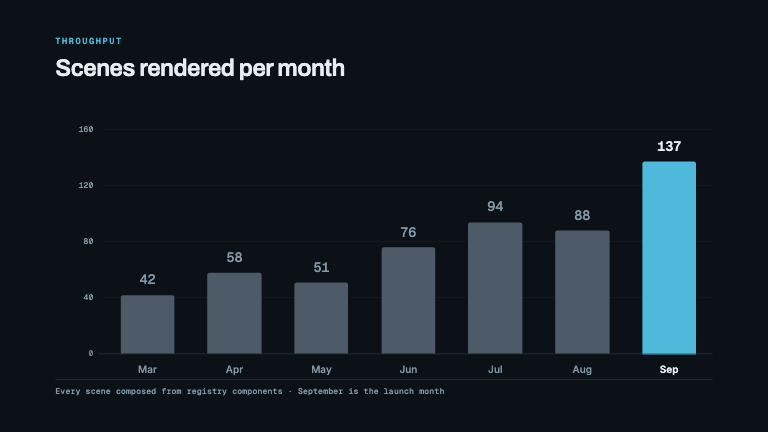
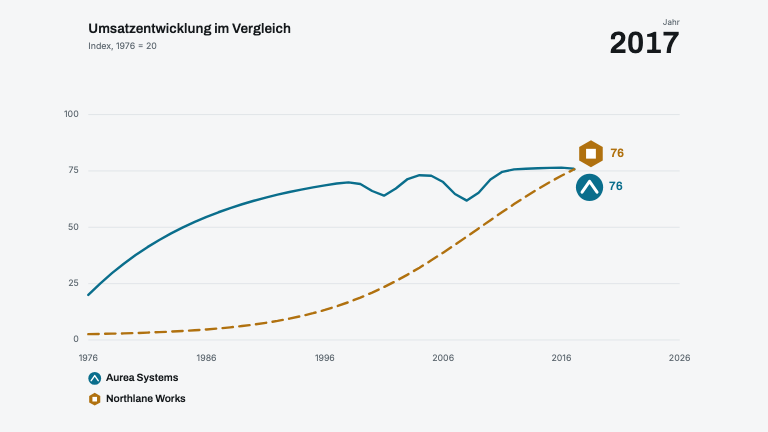
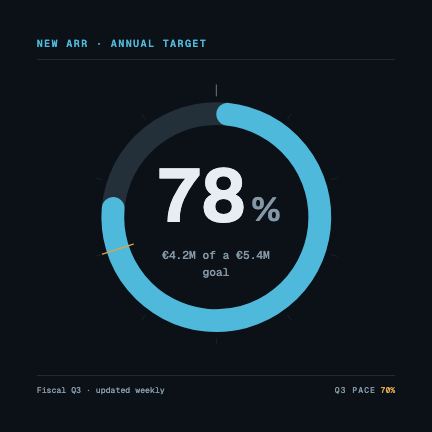
This is the format it was composed for. Switch above to see it lay itself out for another — same animation, re-arranged for the frame.
For developers — source, dependencies and provenance
Dependencies
No Tailwind, no CSS, no asset files. Inline styles only.
Source
Provenance
Prompt
A bar chart that reveals in reading order: the baseline and gridlines draw themselves on as hairlines first, then the bars grow up out of the baseline with a stagger left to right, then the values count up above each bar and the category labels fade in underneath. One bar in the accent colour, the rest muted grey. Y-axis ticks in mono with tabular figures, and round the domain up to a sensible number above the data rather than using the raw maximum.